Store Stock Redistribution supports different calculation types to identify the items that need to be redistributed to other stores. The Stock Balancing calculation type calculates the average stock for the items across all stores. Next, based on current stock and the average stock value, the system will balance the stock between the stores and therefore classify locations into locations with demand or supply.
Calculation example
Item 10000 has an inventory in four locations. The Redist. Calculation Type Stock Balancing is redistributing the items between the locations to evenly distribute the stock. Warehouse locations are not considered in this calculation type.
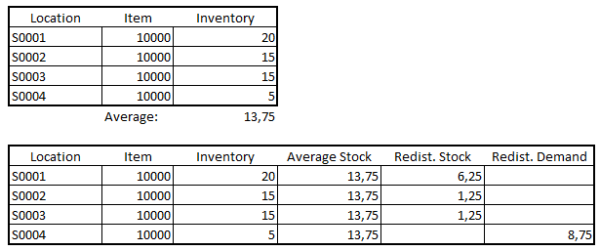
First, the Average Stock is calculated for the item. In a second step every location with Inventory higher than the Average Inventory is considered as a location with supply. The Redist. Stock is the difference between Inventory and Average Inventory. Analogously, locations with Inventory less than the Average Inventory are considered as locations with demand. After reviewing, if needed, you can overwrite the calculated Redist. Stock and Redist. Demand by manually assigning the transfer quantity per item, variant and location in the Retail Item Variant Availability by Location page.
Note: Redist. Demand will be rounded up to the next nearest whole number, and Redist. Stock will be rounded down to the last nearest whole number, if they have a decimal value. In the example above, Redist. Demand of 8,75 will be rounded up to 9, and Redist. Stock of 6,25 will be rounded down to 6.
Setup fields on Redist. Template
| Field | Description |
|---|---|
| Replenishment Type | Here you can select whether the Replenishment Template is to be used for creating Purchase Orders or Transfer Orders. The selection Redistribution is used for Store Stock Redistribution. |
| Redistribution Calculation Type | This field defines the type, how the system calculates the Redist. Stock and Redist. Demand. The available values are:
|
| Redistribution Strategy | Defines the strategy, how the system calculates the trips between stores with Redist. Stock and Redist. Demand. The available values are:
For more information see Redist. Strategies. |
| Create Journal Lines | Defines, if the Redist. Journal is calculated in one or two steps. The available values are:
The first option will only calculate the Redist. Preview and the user can review the results, adjust, and calculate the Journal Lines in a manual second step. |
| Start Date | Defines the starting date to be based on when calculating Sell Through % and Average Daily Sales. |
Filters on Redist. Template
In the Redist. Template you can set the filters that you want to apply to the items considered in the calculation.
| Filter | Description |
|---|---|
| Vendor No. Filter | Here you can enter a filter for the Vendor No. field of the items. An example is 1000 if you only want to select items from vendor number 1000. If you enter 1000..2000 the system will select all items from vendor number 1000 to 2000. |
| Item Division Code | A filter for the Division Code field of the item. |
| Item Category Filter | A filter for the Item Category Code field of the item. |
| Item Product Group Filter | A filter for the Product Group Code field of the item. |
| Item No. Filter | A filter for the item number. |
| Season Filter | A filter for the Season Code field of the item. |
| Special Group Code Filter | A filter for Special Groups. Only items in these Special Groups will be considered in the calculation. |
| Item Attribute Filter | A filter for Attributes. |
| Variant Dimension Filter
|
A filter for Variant Dimension Values. |
| From Location Filter
To Location Filter |
Filter for From Location and To Location. When Store Stock Redistribution calculates the inventory in the Locations, it classifies Locations into Supply Locations (=From Location Filter) and Demand Locations (=To Location Filter). When the Calculation Type Stock Balancing is used, From Location Filter and To Location Filter always have the same value. Locations that are filtered out will not appear in the Preview and Journal Lines. |
Calculation result
The calculation of Redist. Preview is initiated with the Add Items to Journal/Preview action on the Redistribution Replenishment Journal page.
When the Preview is calculated, the Show Redist. Preview action opens the Redistribution Journal Preview page where you can view the calculated Redist. Demand and Redist. Stock information of the items. Click here for more information on how Redist. Preview is calculated.
From the Redist. Journal Preview, the Show Items Availability action, or a lookup on the Stockout% or Variant Availability % opens up the Retail Item Variant Availability by Location page. There, you view the variant availability and, together with the calculated sales factor (such as Sell Through %), you can determine how the variants can be redistributed among the stores and manually overwrite the calculated Redist. Stock and Redist. Demand, if needed. For more information on how to manually assign Redist. Stock and Redist. Demand, please refer to Retail Item Variant Availability by Location.
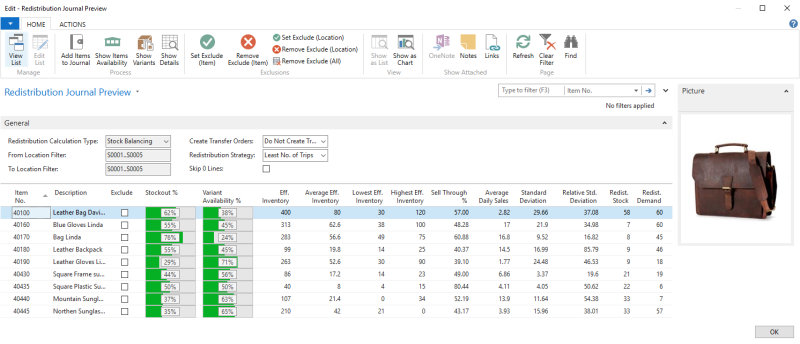
Fields on Redistribution Journal Preview
| Field | Description |
|---|---|
| Item No. | Defines the Item Number. |
| Exclude | Items with this check box selected will be excluded from redistribution trips calculation. |
| Stockout % | Defines the ratio of out-of-stock item variants to the total number of item variants from all stores. |
| Variant Availability % | Defines the ratio of in-stock item variants to the total number of item variants from all stores. |
| Eff. Inventory | Defines the total inventory of the item, considering also the Purchase Orders, Sales Orders, and Transfer Orders that have not been posted. |
| Average Eff. Inventory | Defines the average effective inventory of the item across all stores. |
| Lowest Eff. Inventory | Defines the lowest effective inventory of the item across all stores. |
| Highest Eff. Inventory | Defines the highest effective inventory of the item across all stores. |
| Sell Through % | Defines the ratio of total sold inventory of the item as of today to its total inventory as of start date. |
| Average Daily Sales | Defines the calculated average daily sales of the item from the start date until the current date. |
| Standard Deviation | Defines the standard deviation of the item's effective inventory across all stores. This is used to quantify the amount of variation or dispersion of the item. |
| Relative Std. Deviation | Defines the ratio of the Standard Deviation to the Average Eff. Inventory. |
| Redist. Stock | Defines the total redistributable quantity of the item across all stores. |
| Redist. Demand | This field defines the total demand quantity of the item across all stores. |
See Also
Redistribution Calculation Types